 ISO 24444 / ISO 24443
 EU COLIPA and SANS 1557 Verified Broadspectrum Sunscreens
Weather charts provide a visual representation of current atmospheric conditions across South Africa and Africa. These charts help meteorologists and the public understand weather patterns, frontal systems, and temperature variations to better plan outdoor activities and appropriate sun protection.

Synoptic weather charts display current atmospheric conditions and weather systems over a geographical area. These charts use standardized symbols to show:
Meteorologists use these charts to forecast weather conditions and predict changes in temperature, precipitation, and wind patterns over the coming days.

While monitoring weather conditions is important, it's essential to remember that UV radiation levels don't always correlate with temperature or cloud cover:
ISO 24444 / ISO 24443 Free Delivery
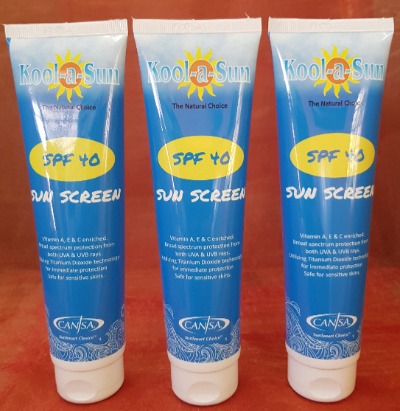 Three x 150ml SPF40 Free SA Delivery
Kindly contact us for any sunscreen or UV protection cream requirement