Weather charts provide a visual representation of current atmospheric conditions across South Africa and Africa. These charts help meteorologists and the public understand weather patterns, frontal systems, and temperature variations to better plan outdoor activities and appropriate sun protection.
Where it is storming and raining right now
Raining now:
dry in all 12 major centres (station model, last hour — 00:54 SAST; satellite scan 00:30 SAST)
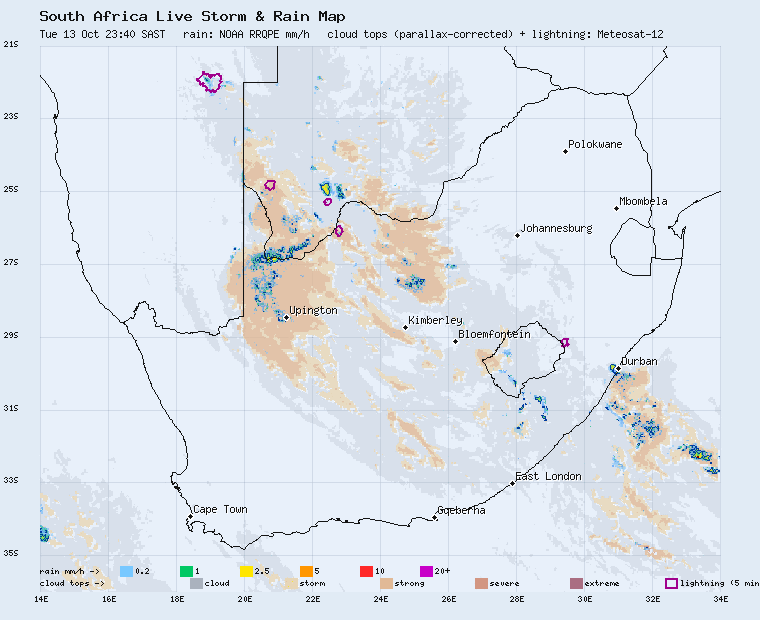
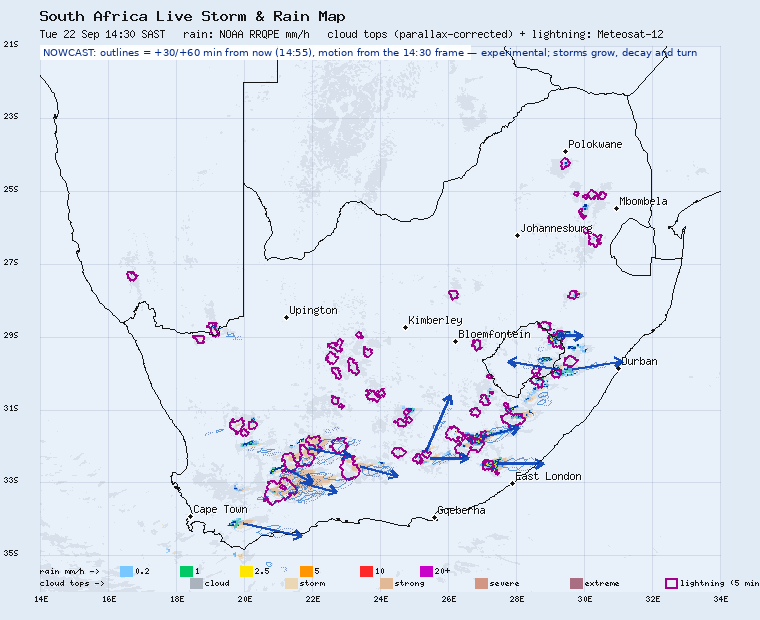
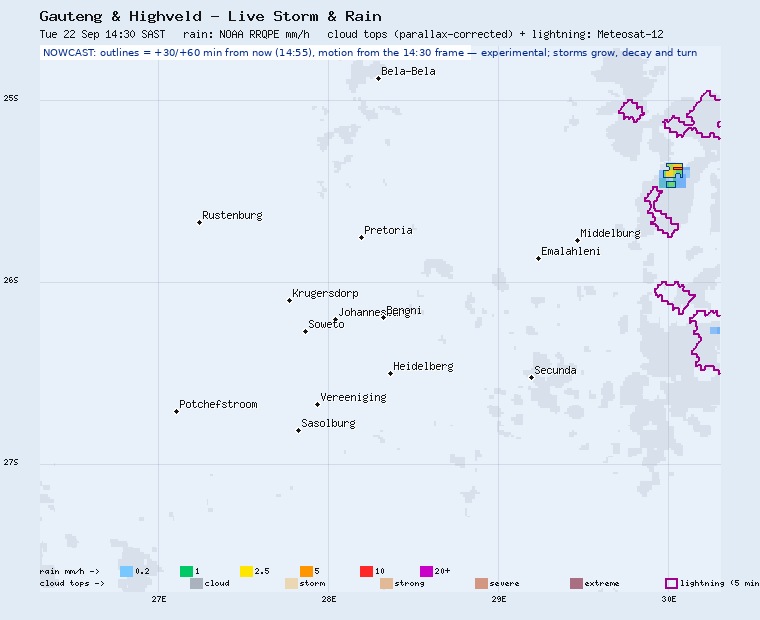
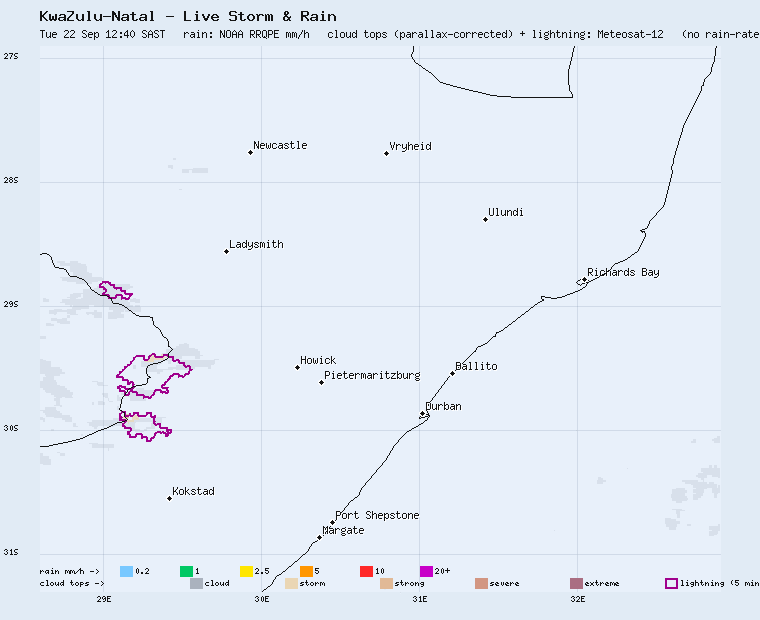
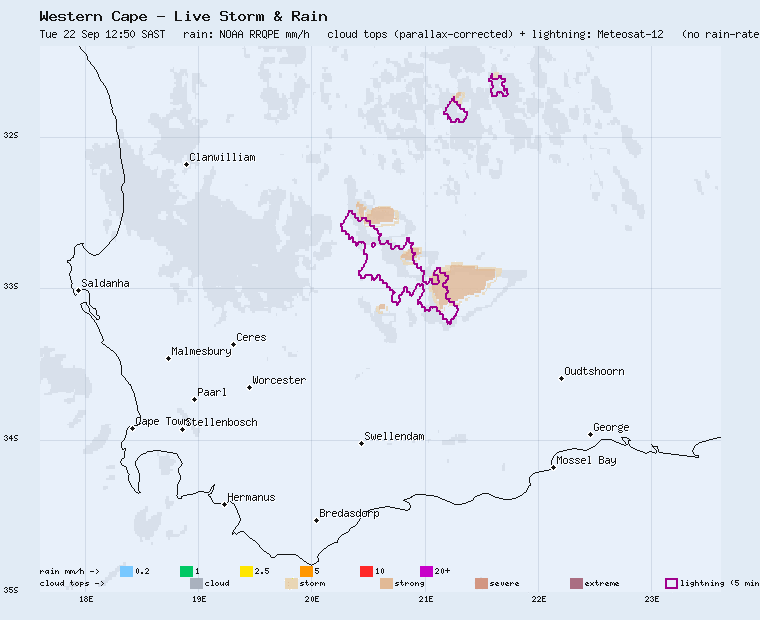
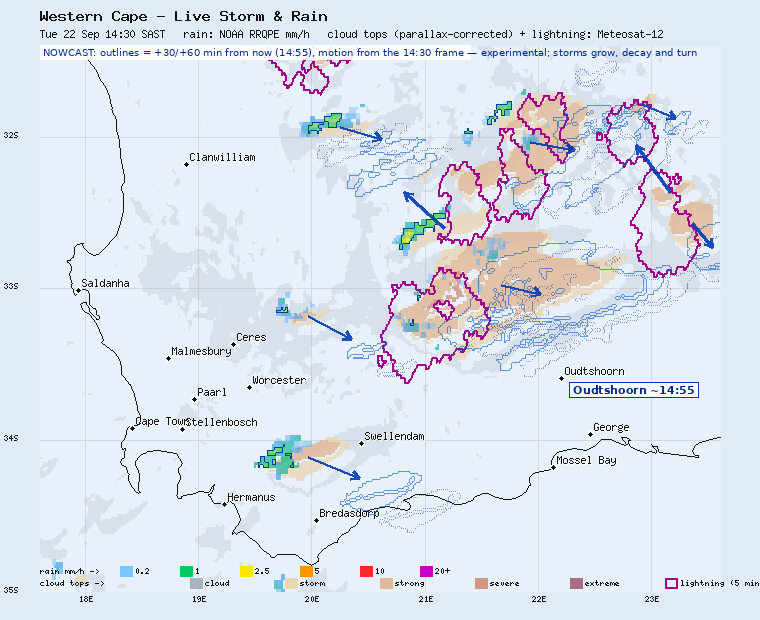
Live satellite storm map from Meteosat-12, the new third-generation weather satellite (2 km detail, a frame every 10 minutes) — the last 2 hours, looping. Yellow → orange → red → purple is colder and colder storm cloud-top (stronger updraughts, heavier rain and hail), grey is other cloud, and the pink areas are where its Lightning Imager saw flashes in the last five minutes.
Storm arrivals (next 90 min) — from the 00:30 frame, positions advanced to 00:55. Experimental: storms grow, decay and turn.- Kimberley — strong storm overhead now, trailing edge passing now
- Upington — severe storm overhead now, clearing by about 03:04
- Bloemfontein — strong storm 79 km away, moving SE at 81 km/h, arriving about 00:55
- Durban — rain was last overhead at 23:50; nothing tracked over the town now — showers may linger
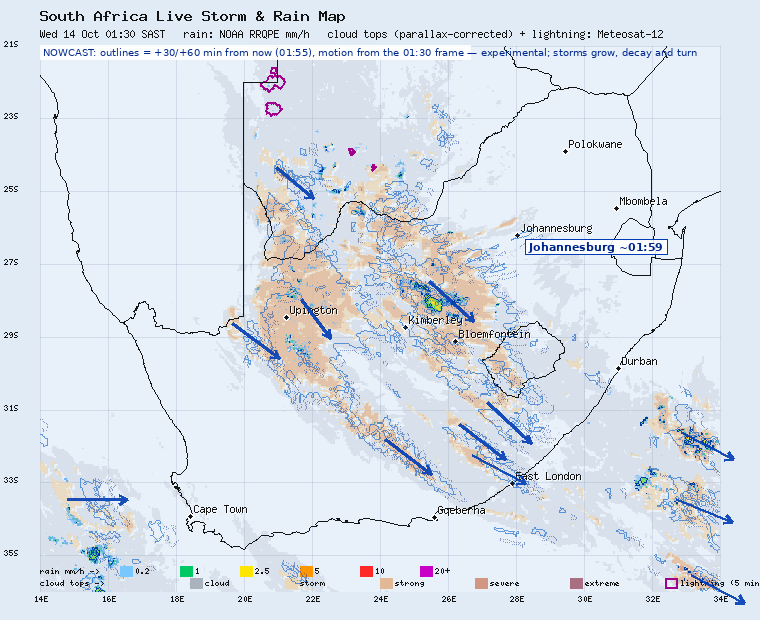
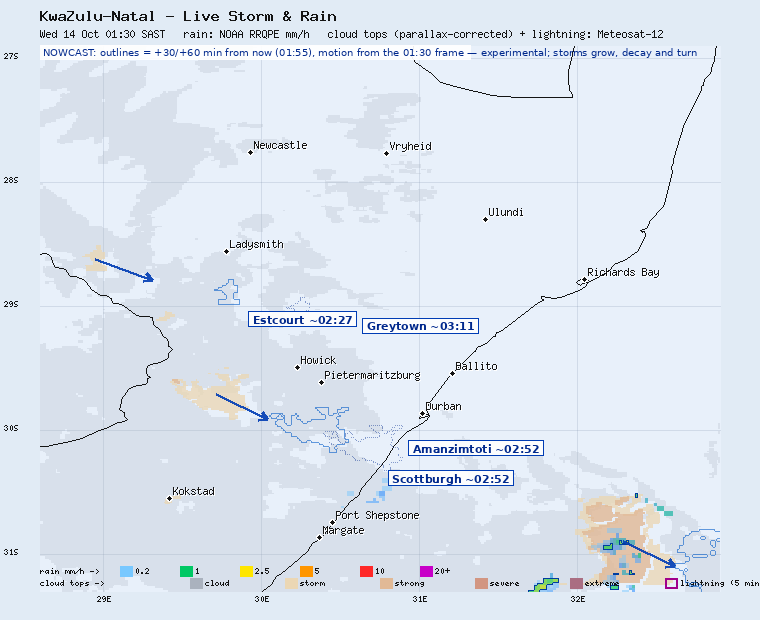
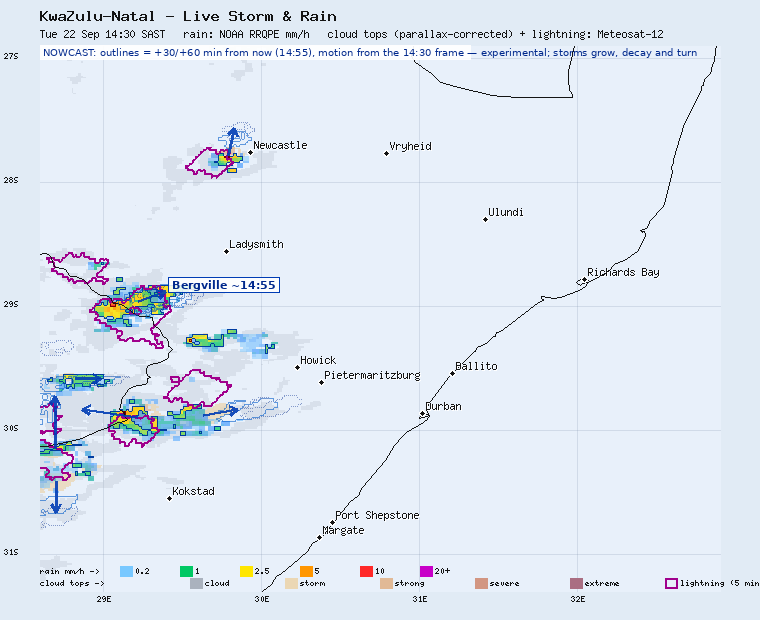
Nowcast — the latest frame with each storm cell's motion arrow and its projected outline 30 (solid blue) and 60 minutes (dotted) ahead, with arrival times at towns in its path.
Precipitation estimates: NOAA/NESDIS Enterprise Rain Rate (RRQPE), satellite-derived mm/h every 10 minutes. Cloud tops: EUMETSAT Meteosat-12 (MTG) infrared 10.5 µm with the operational cold-top enhancement; lightning: MTG Lightning Imager. Station rain figures: Open-Meteo. Base map self-generated by Kool-a-Sun. Radar overlay is added automatically whenever the RainViewer network carries South African radar (it currently does not).
Understanding the Storm & Rain Map
South Africa's weather radars are not published as open data (the SAWS network is restricted to aviation users, and the North-West University's research radar near Potchefstroom has been offline since March 2026), so this map is built from the Meteosat-12 weather satellite instead. Its infrared channel measures how cold each cloud top is: the colder the top, the higher and more violent the updraught beneath it. Its Lightning Imager sees the flashes directly, day and night.
- Rain in mm/h (blue → green → yellow → red): NOAA's satellite rain-rate estimate, the same observed-precipitation product used in US forecast offices, with contour lines at 1, 5 and 20 mm/h. This is measured rainfall intensity, not a colour guess.
- Cloud tops (yellow, orange, red, purple): colder and higher tops under the rain layer — from an ordinary shower cloud to a severe storm with hail and damaging wind under the purple.
- Pink is lightning: where the satellite's Lightning Imager recorded flashes in the last five minutes. If pink is over you, you are in the storm, not near it.
- Grey is ordinary cloud: overcast, possibly light steady rain, but no storm signature. The "Raining now" line above uses station figures for that.
- The loop shows movement: two hours of frames reveal which way the storms are tracking and whether they are growing or fading.
- Refreshed every 10 minutes as Meteosat-12 publishes each frame; the map runs about 25 minutes behind real time.
Use the radar to time outdoor activities — and remember UV stays high even under cloud, so keep your sunscreen on between the showers.
Regional close-ups — Gauteng & Highveld, KwaZulu-Natal, Western Cape
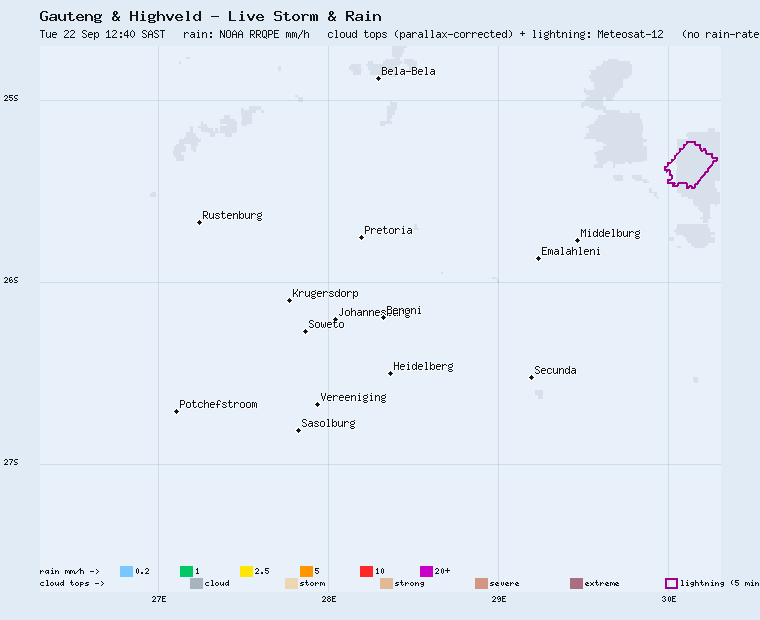
The same satellite frames, zoomed to the three busiest regions with local towns marked. Each loop covers the last two hours.
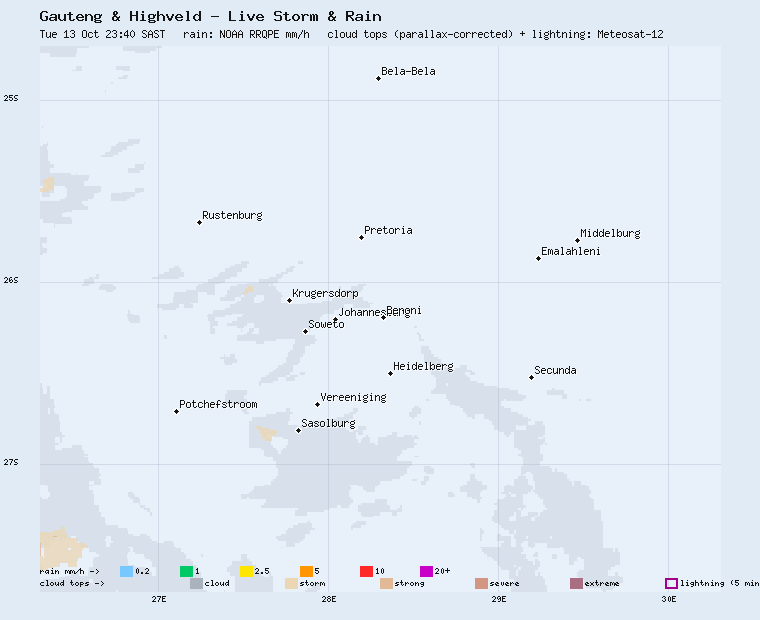
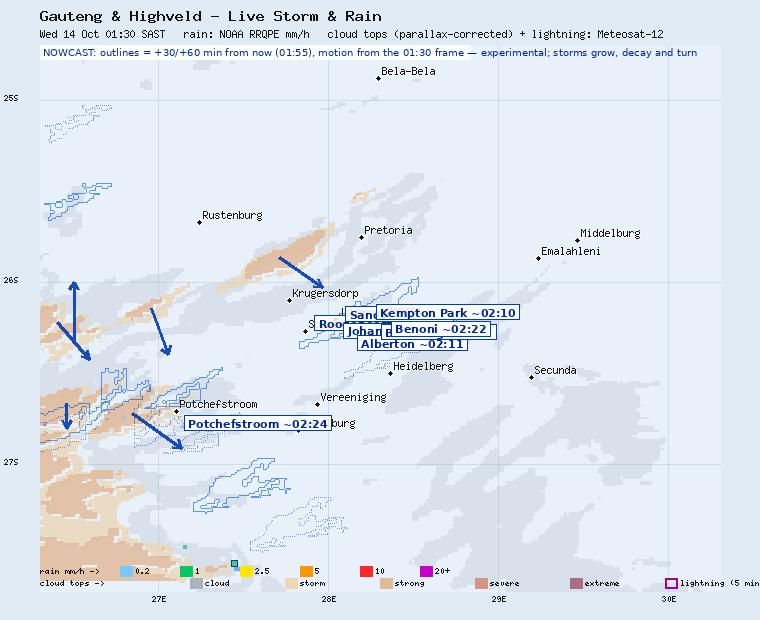
Gauteng & Highveld — Johannesburg, Pretoria, the East Rand, Vaal Triangle and the Highveld coalfields.
Storm arrivals (next 90 min) — from the 00:30 frame, positions advanced to 00:55. Experimental: storms grow, decay and turn.- Carletonville — strong storm 75 km away, moving SE at 59 km/h, arriving about 01:57
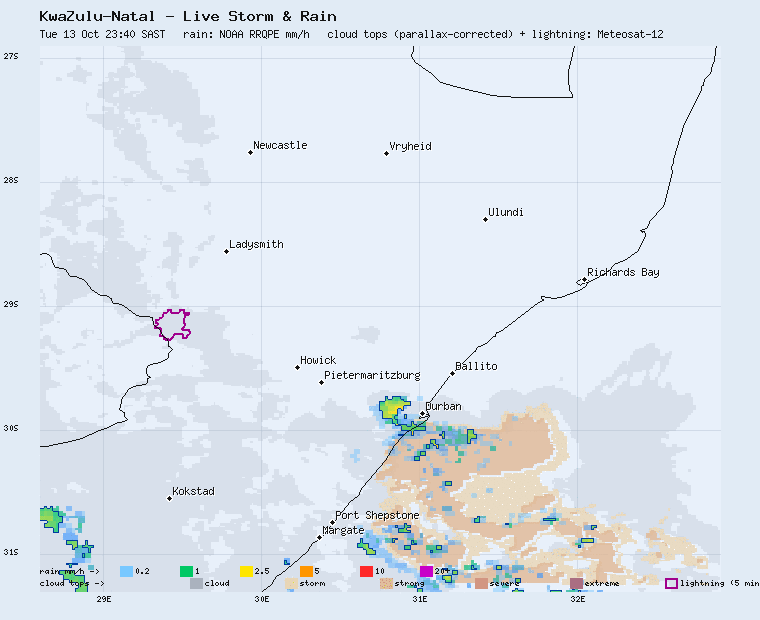
KwaZulu-Natal — Durban and the coast from Port Shepstone to Richards Bay, the Midlands and the Drakensberg foothills.
Storm arrivals (next 90 min) — from the 00:30 frame, positions advanced to 00:55. Experimental: storms grow, decay and turn.- Durban — rain was last overhead at 23:50; nothing tracked over the town now — showers may linger
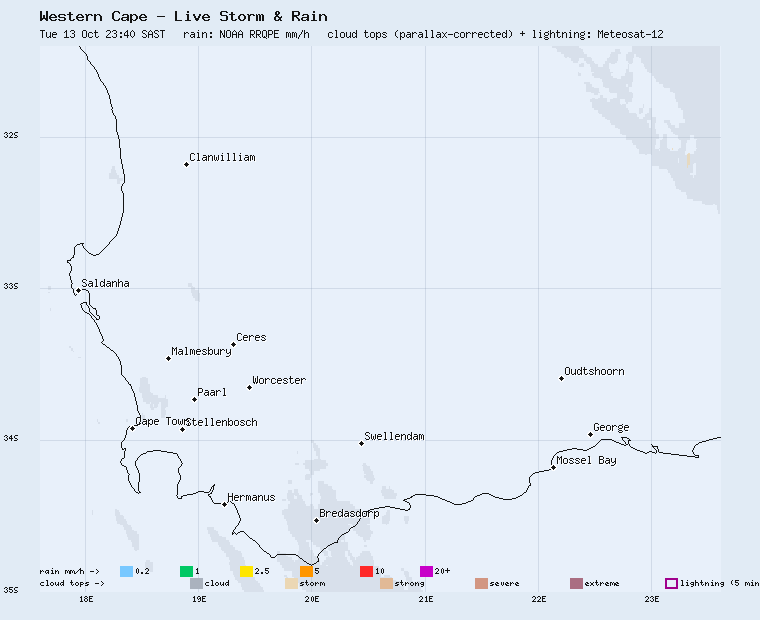
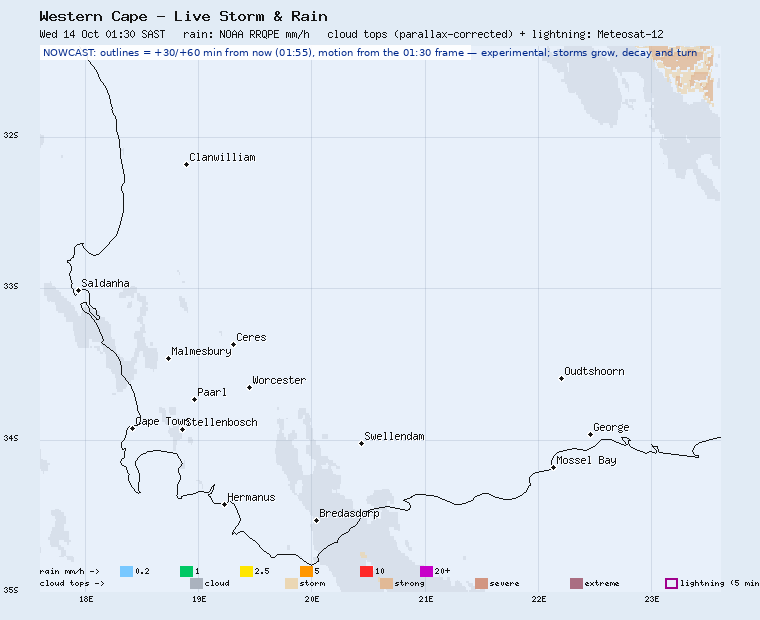
Western Cape — Cape Town and the Winelands, the Overberg and the Garden Route to George.
Storm arrivals (next 90 min) — from the 00:30 frame, positions advanced to 00:55. Experimental: storms grow, decay and turn.- Hermanus — slow-moving storm 24 km away
- Caledon — slow-moving storm 30 km away
- Gansbaai — slow-moving storm 14 km away
Africa Low Temperature Map
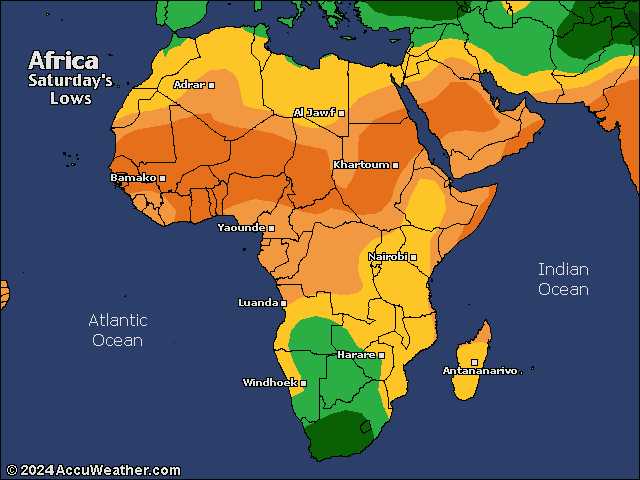
Current low temperature conditions across the African continent
Weather & Sun Protection Considerations
While monitoring weather conditions is important, it's essential to remember that UV radiation levels don't always correlate with temperature or cloud cover:
- UV radiation can be high even on cool or cloudy days
- High-pressure systems typically bring clear skies and increased UV exposure
- Cold fronts may temporarily reduce UV levels but can be followed by intense clear conditions
- Always check the UV Index along with weather charts for complete protection
Current Weather Conditions For SA Cities
 ISO 24444 / ISO 24443

 Three x 150ml SPF40 Free SA Delivery